
Impact Evaluation of Cement Flooring Welfare Program

This project replicates and interprets the results of the Matias D. Cattaneo, Sebastian Galiani, Paul J. Gertler, Sebastian Martinez, and Rocio Titunik’s (2009) “Housing, Health, and Happiness” study.
I Abstract
The “Housing, Health, and Happiness” study concerns the impact of Piso Firme, a program that provided resources for low-income families in the State of Coahuila, Mexico to replace the dirt floors in their homes with cement floors. This study primarily focuses on quantifying the changes in parasitic infestations in young children, maternal happiness, and the subsequent long-term effects on the families’ health and welfare due to the administration of Piso Firme.
The study found that Piso Firme not only significantly decreased the prevalence of parasitic infestations, anemia, and diarrhea in young children but also improved their cognitive development as well. In addition, the study also discovered that the adults of the household also experience a substantial improvement in mental health and quality of life.
II Data Description
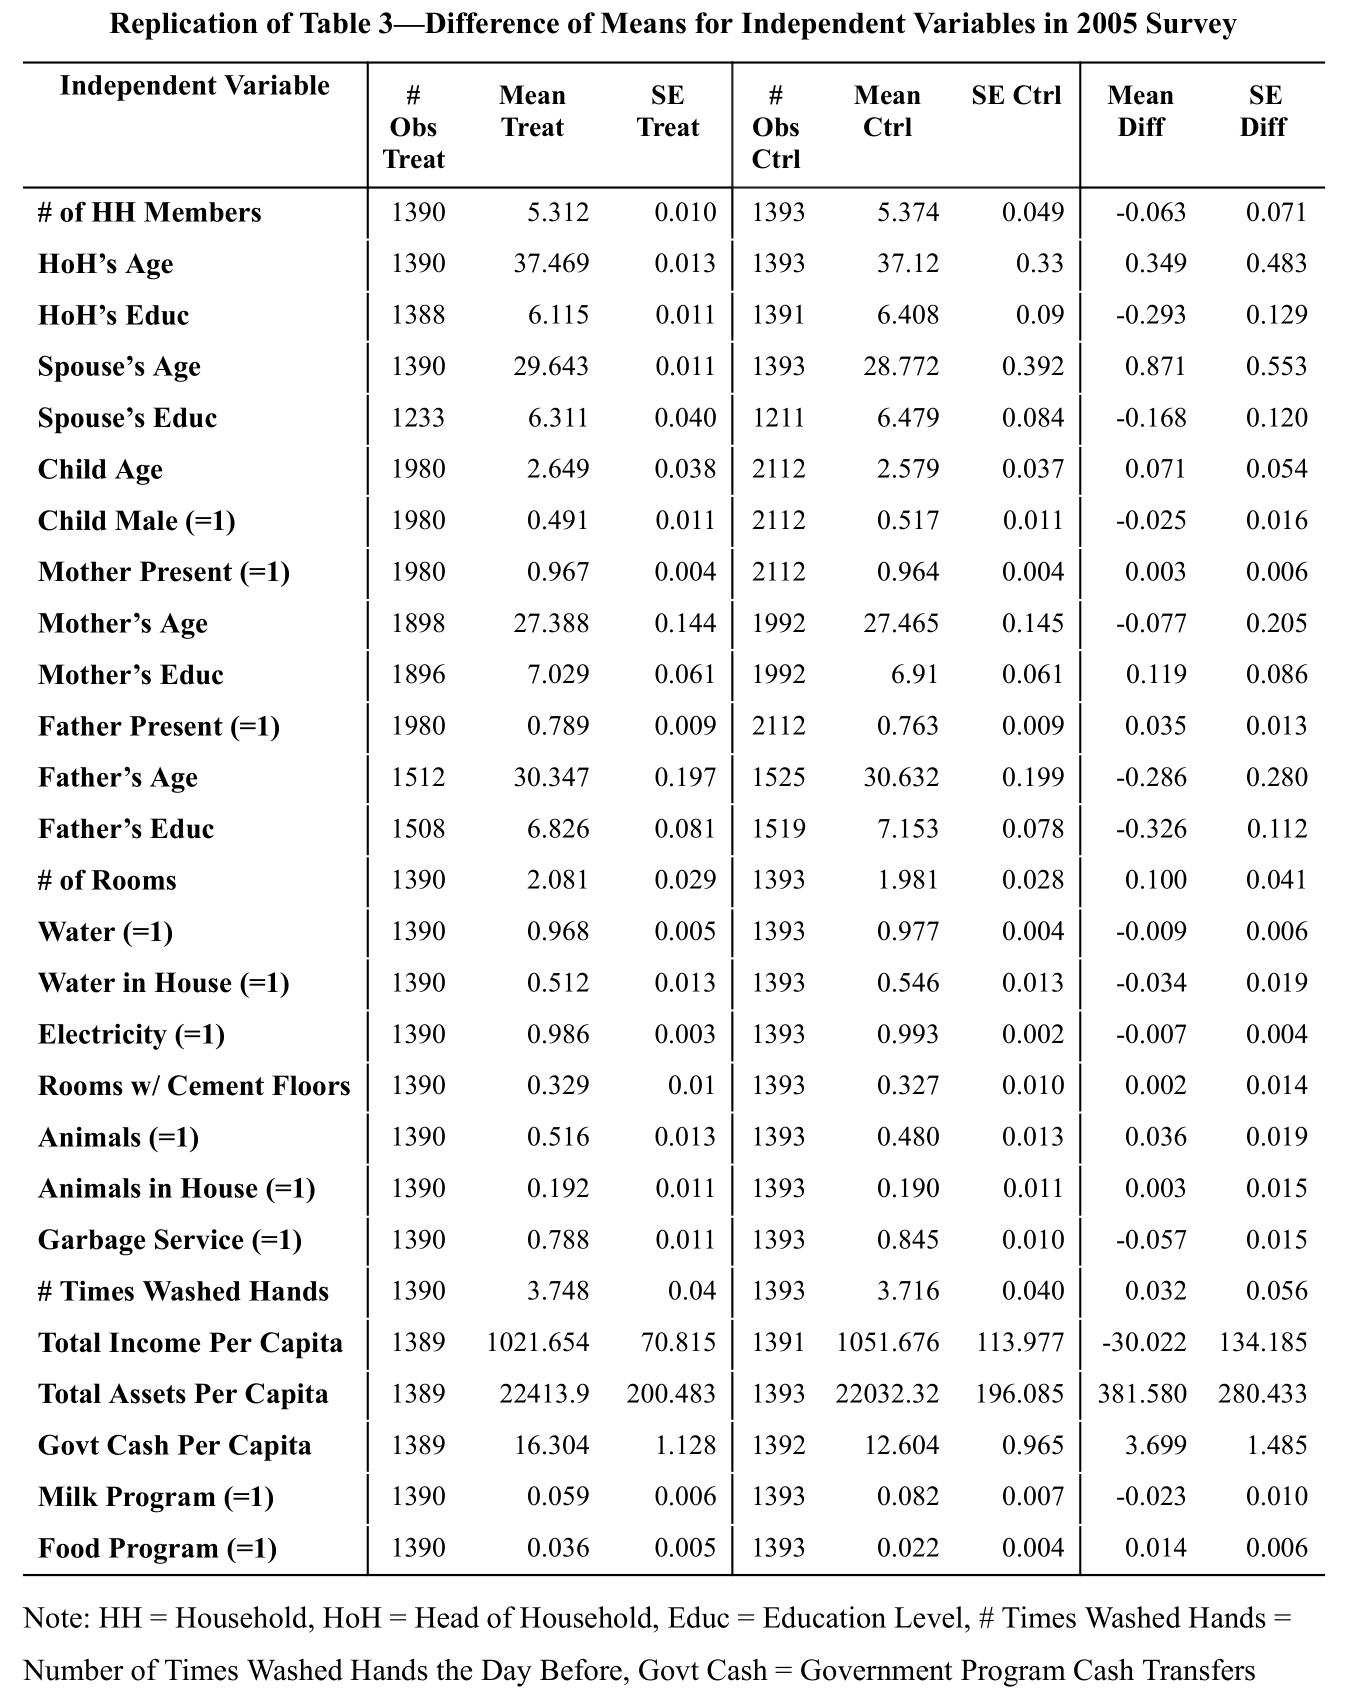
This study utilizes a cross-sectional household survey detailing the variables of interest in both the treatment groups (families residing in Torreón on the border of the State of Coahuila) who participated in Piso Firme and control groups (families residing in Lerdo/Gómez Palacios on the border of the State of Durango) who did not participate in Piso Firme at the time of observation. The study received 1390 completed surveys in the treatment area and 1393 completed surveys in the control area, resulting in a response rate of about 93% in both groups. Detailed information was collected concerning “household demographic structure, socioeconomic status, housing infrastructure (including detailed information on the type of floor in each room of the house), health outcomes, and cognitive development of children less than six years old, as well as happiness and mental health indicators for their mothers” (Matias D. Cattaneo et al. 2009).
III Summary Statistics Tables and Interpretations
The replication of Table 3 below details the number of observations, means, and standard errors for every independent variable in the treatment and control groups. It also includes the difference in both the means and the standard errors, which we can see are relatively small. This indicates that our treatment and control groups were well-balanced at the time when data was collected. However, we will account for these slight differences between the two groups during our analysis.
IV Replicate Main Results
Linear Model Assumptions and Appraisal
The following are assumptions for linear models:
- Linearity
The relationship between the dependent variable(s), Y, and the predictor variable(s), X, is linear: $Y= X \beta + \epsilon$
While Cattaneo et al. (2009) do not clearly state their assumption of linearity, by utilizing linear models throughout their study, they imply that the dependent variables listed in the tables below are able to be explained by features regarding Piso Firme treatment, age, demographics, and health-habits through a linear relationship.
- Independence
The response variable Y is independent of the residuals $\epsilon \;$: \(cov \begin{pmatrix} \hat{Y} \\ \hat{\epsilon} \end{pmatrix} = \sigma^2 \begin{pmatrix} H & 0_{nxn} \\ 0_{nxn} & I_n - H \end{pmatrix}\)
The paper also assumes that there is no spatial autocorrelation present between the clusters in which they sampled their data. However, they assume that there is correlation within the clusters. This assumption is valid as they prove in their robustness checks that the error terms of the models were not correlated across clusters and hence they are justified in their use of this clustering structure.
- Normality
The residuals $\epsilon$ are normally distributed: $\epsilon \sim N(0, \sigma^2 I_n)$ or $\epsilon_i \overset{\text{iid}}{\sim} N(0, \sigma^2)$ where $\sigma^2$ is an unknown parameter.
This assumption of normality can be validated by confirming that the observations are near the line of a normal probability plot or by verifying that the histogram of the residuals resembles a normal distribution. However, this paper does not explicitly address the assumption of normality.
- Homoskedasticity
The residuals $\epsilon$ have the same constant variance $\sigma^2$: \(cov(\epsilon) = \sigma^2 I_n\)
Cattaneo et al. (2009) do not assume homoskedasticity, since they use robust clustered standard errors. They are instead assuming that the census block clusters have different variances.
Treatment Effect Heterogeneity (or Difference-in-Difference) Assumptions:
We can formulate the problem in terms of linear regression $y_i = \beta_0 + \beta_1 z_i + \beta_2^T x_i + \beta_3^T x_i z_i + \epsilon_i$ where $y_i$ is the dependent variable, $x_i$ are the covariates, and $z_i$ is the binary treatment variable.
The control group acts as a proper counterfactual for the treatment group.
Trends in the treatment group and control group would have been the same in the absence of treatment.
By restricting the sampling to similar socioeconomic and geographical locations and implementing a consistent eligibility criteria on all surveyed households, the paper confirms that the treatment and control groups act as appropriate comparisons for one another with respect to the observed features.
Main Result Replication and Interpretation
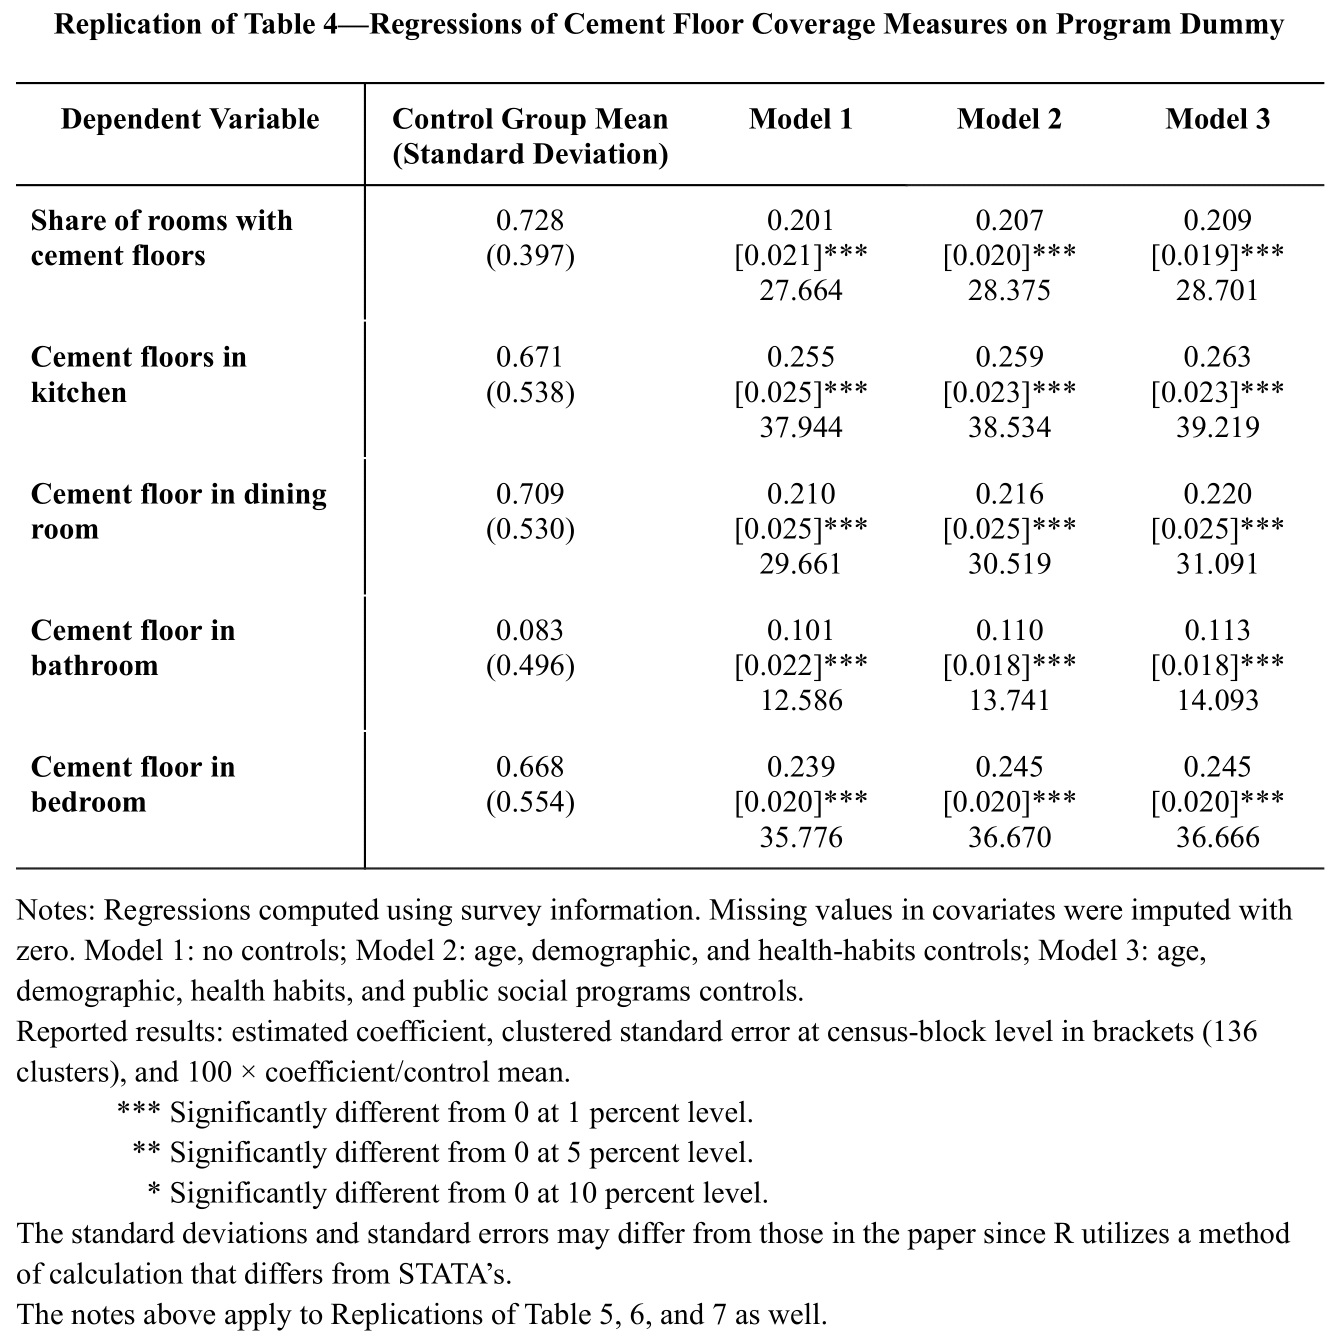
Looking at our table above, we can see from the control group means that control households had cement floors in about 73% of their rooms in 2005. In particular, over 66% of control households report having cement floors in their kitchens, dining rooms, or bedrooms. However, bathrooms had the lowest cement floor coverage, with only 8% of control households having bathrooms with cement floors.
In 2005, we also observed an average increase in cement flooring of about 28% in the share of rooms with cement floors in treated households. Additionally, we see similar positive effects in all other reported areas: kitchens (38%), dining rooms (30%), and bedrooms (36%). Once again, the outcomes regarding bathrooms (13%) were not as substantial.
Because our estimates are all significant at a 0.01 level, we can say that Piso Firme had a substantial impact on each of the dependent variables listed in Table 4. Noting the similarities of our estimates across the different models, we also deem our findings to be extremely robust. All in all, Piso Firme was successful in encouraging families to set up cement flooring in their homes.
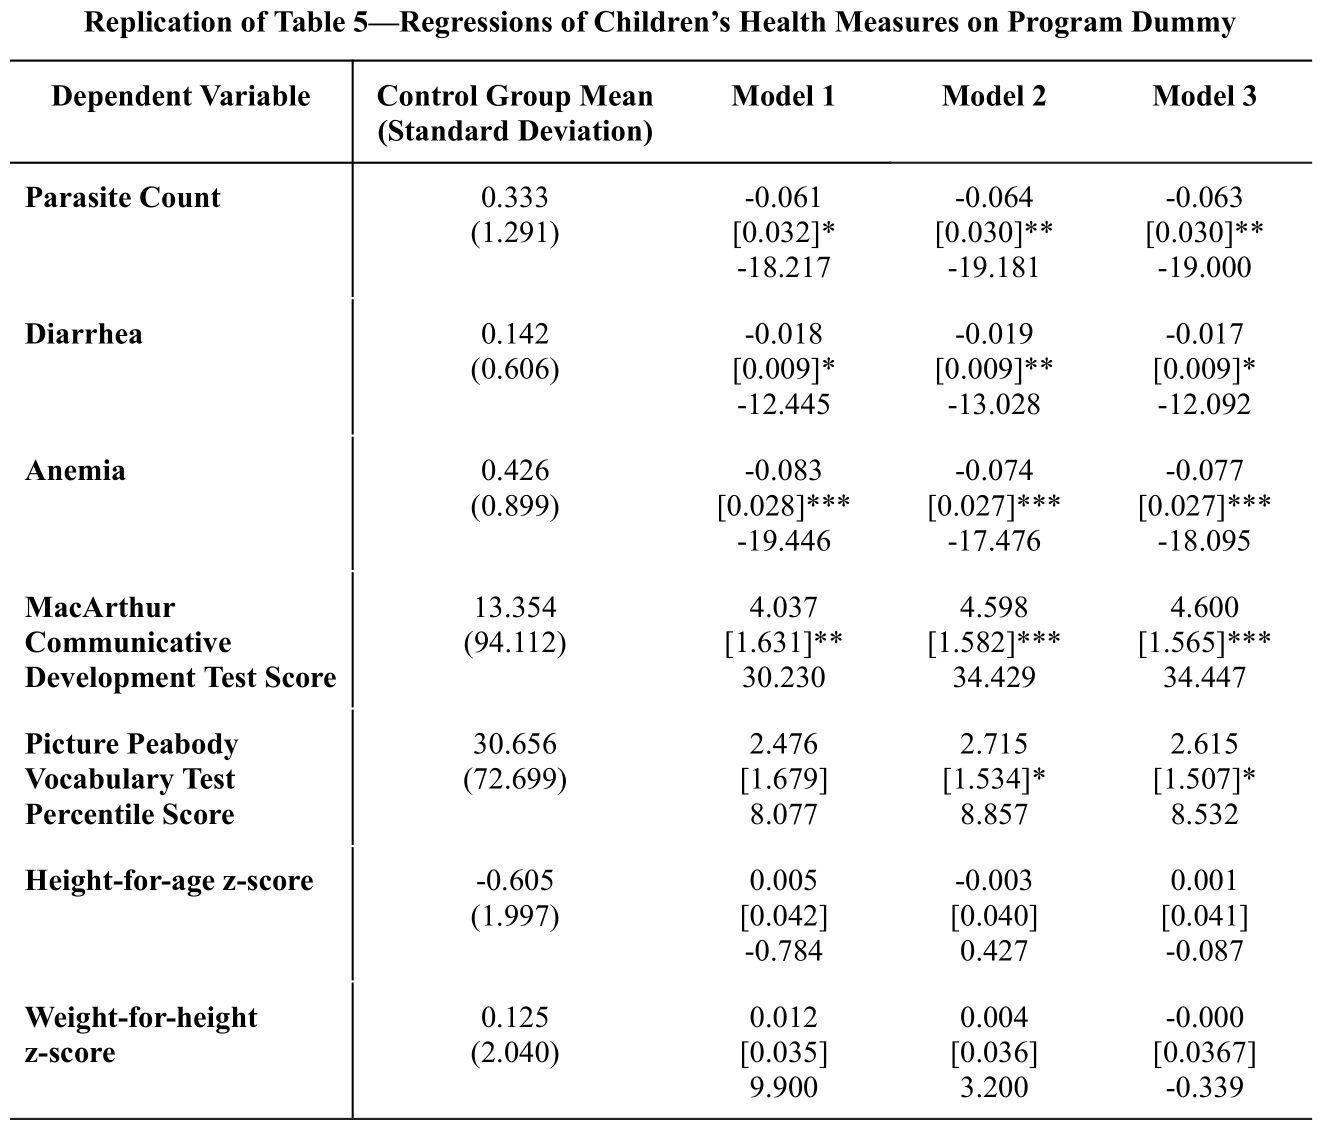
In control households, approximately 33% of the children under 6 years old report parasitic infestations, 14% report cases of diarrhea, and 43% report anemia. Now examining the model estimates, we can see that the Piso Firme program resulted in about an 18% reduction of parasite prevalence, a 12% decrease in incidences of diarrhea, and a 19% decrease in cases of anemia with respect to the control group. Children in the treatment group also achieved MacArthur test scores that were 30% higher and PPVT test scores that were 8% higher than the scores from the control group. In regards to the height and weight z-scores, participation in the program did not yield any significant changes.
Overall, we note that participation in Piso Firme is associated with decreased parasitic infestations, less cases of diarrhea and anemia, and improved child cognitive development. Moreover, the estimates are again consistent throughout the different models, so we can say that these results are extremely robust.
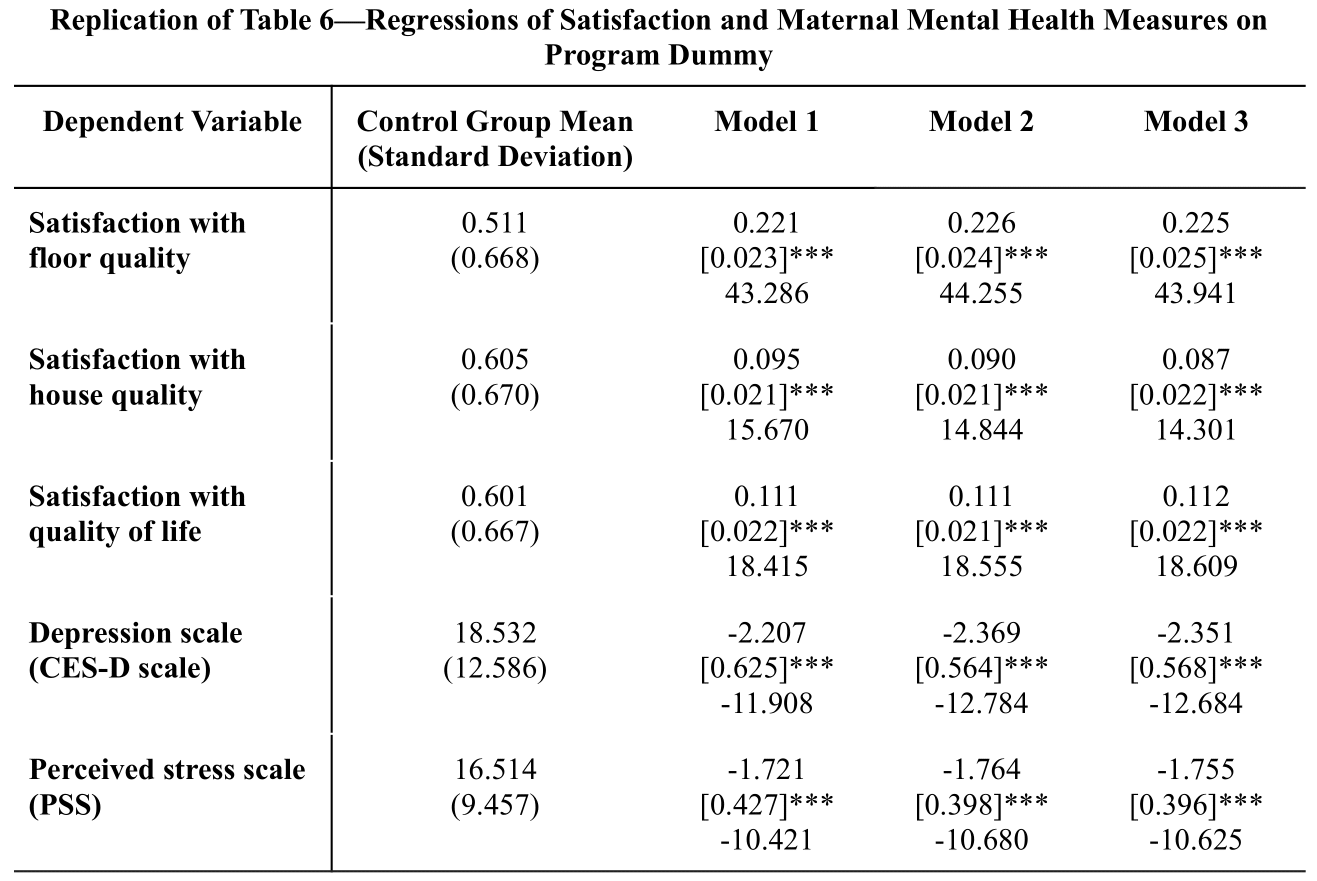
Looking at our coefficient estimates in Table 6, we see that compared to the control group, the treatment group has a higher satisfaction with floor quality (43% higher), house quality (16% higher), and quality of life (18% higher). We also observe that the depression and perceived stress scales are, respectively, about 12% and 11% lower for the treatment group.
The table results show that estimates are similar and significant across all models, making the estimates extremely robust to all model specifications. Once again, we remark that Piso Firme resulted in a boost in maternal satisfaction levels and improved mental health.
V Replicate Robustness Checks
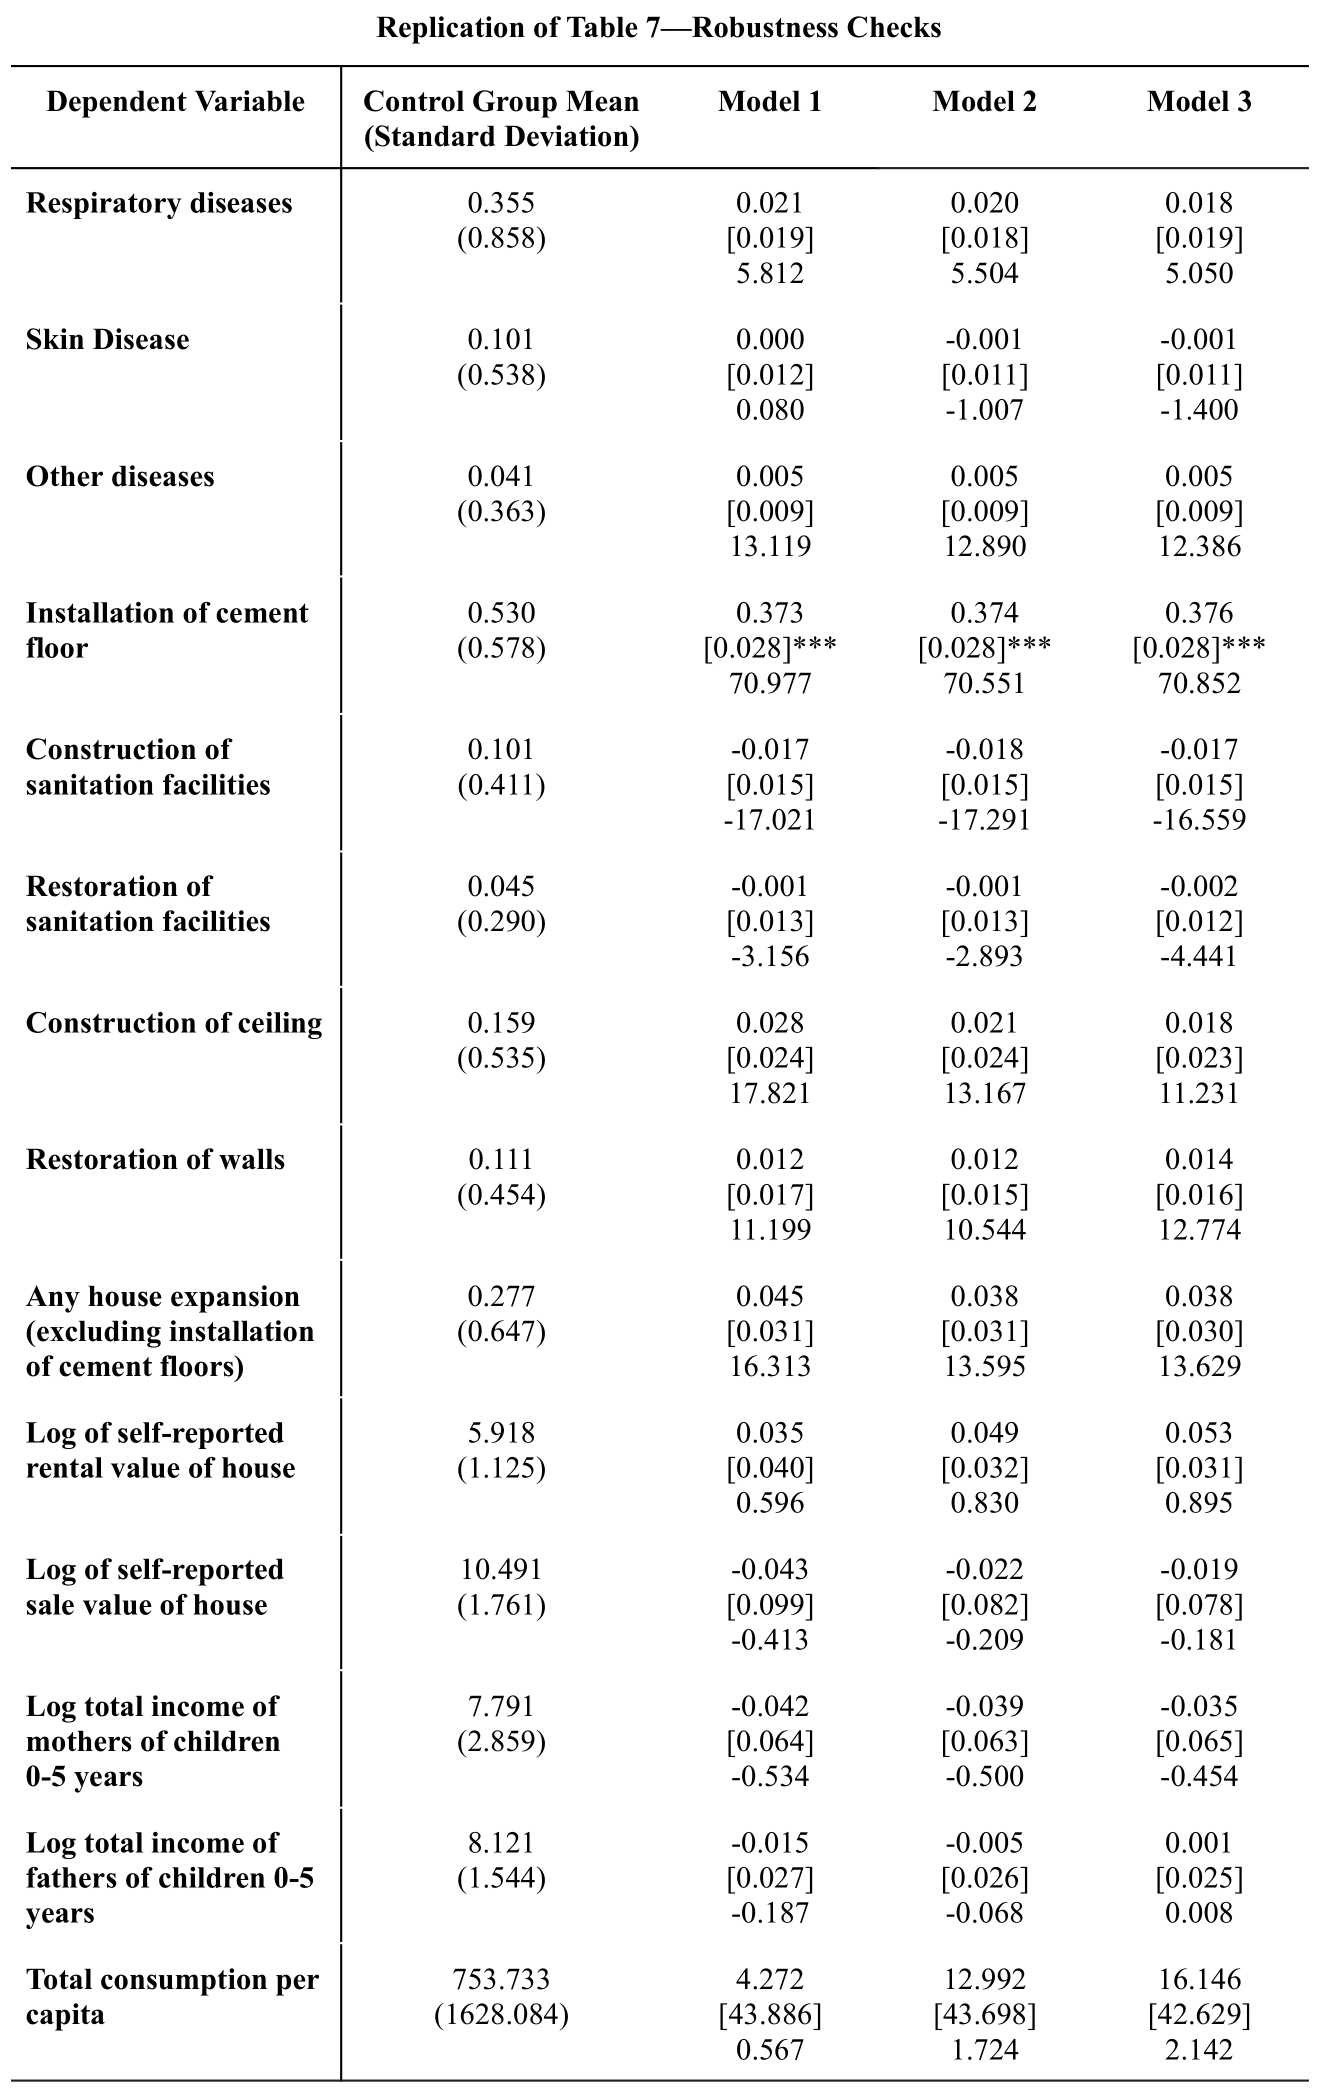
Table 7 includes robustness checks that verify if the results of Piso Firme were influenced strictly through the installation of cement flooring and the reduction of parasitic infections rather than extraneous factors such as other diseases, home improvements, or economic advancements.
After conducting the same analysis used in Section IV to examine diseases that seemingly should not have been impacted by the flooring improvements, we see that our binary treatment variable is not significantly associated with respiratory, skin, or other diseases. This implies that there were no meaningful differences between the treatment and control groups in terms of the specified diseases, and thereby suggesting that the results previously found cannot be explained by these alternative illnesses.
Table 7 also indicates that, after accounting for the replacement of dirt floors, treatment households did not improve their homes any more than those in the control group did. In particular, there were no significant differences between treatment and control households in terms of the construction or restoration of sanitation facilities, ceilings, walls, or any other home improvement. We henceforth say that Piso Firme did not impact the participating households by encouraging additional home improvements.
Moreover, we also want to verify whether the outcomes were influenced by other economic advancements. For instance, if households used the money allotted to them for purposes other than installing cement floors, this could have created an alternative economic resource channel that influenced the outcomes of interest. However, the results in Table 7 show that the alternative economic resource was not an explanation for the effects we observed. In particular, we see that the difference in self-reported home sale value between treatment and control households was not significantly different. Additionally, Piso Firme participation was not shown to be associated with the total income and total consumption variables, indicating that there were no significant differences between treatment and control households in these aspects as well.
In conclusion, through the robustness checks, we have verified that there were no external factors that affected our results. We confirmed that the effects of Piso Firme were due to the interruption of parasitic infection through cement flooring rather than through other diseases, alternative economic resource channels, or additional home improvements.
VI Re-analysis
Since we are using clustered panel data, we decided to re-analyze the paper’s results using a standard error with homoskedastic assumptions and a clustered standard error for panel data (Newey-West [1987] and Driscoll and Kraay [1998]) which we compared to the paper’s census-block-clustered standard error. Because the coefficient estimates remained the same regardless of which standard error was used, we only reported the different standard errors and their corresponding significance values.
For our purposes, we will now denote the standard errors with homoskedastic assumptions as “naive standard errors”, the census-block clustered standard errors as “CL standard errors”, and the clustered standard errors for panel data as “PL standard errors”.
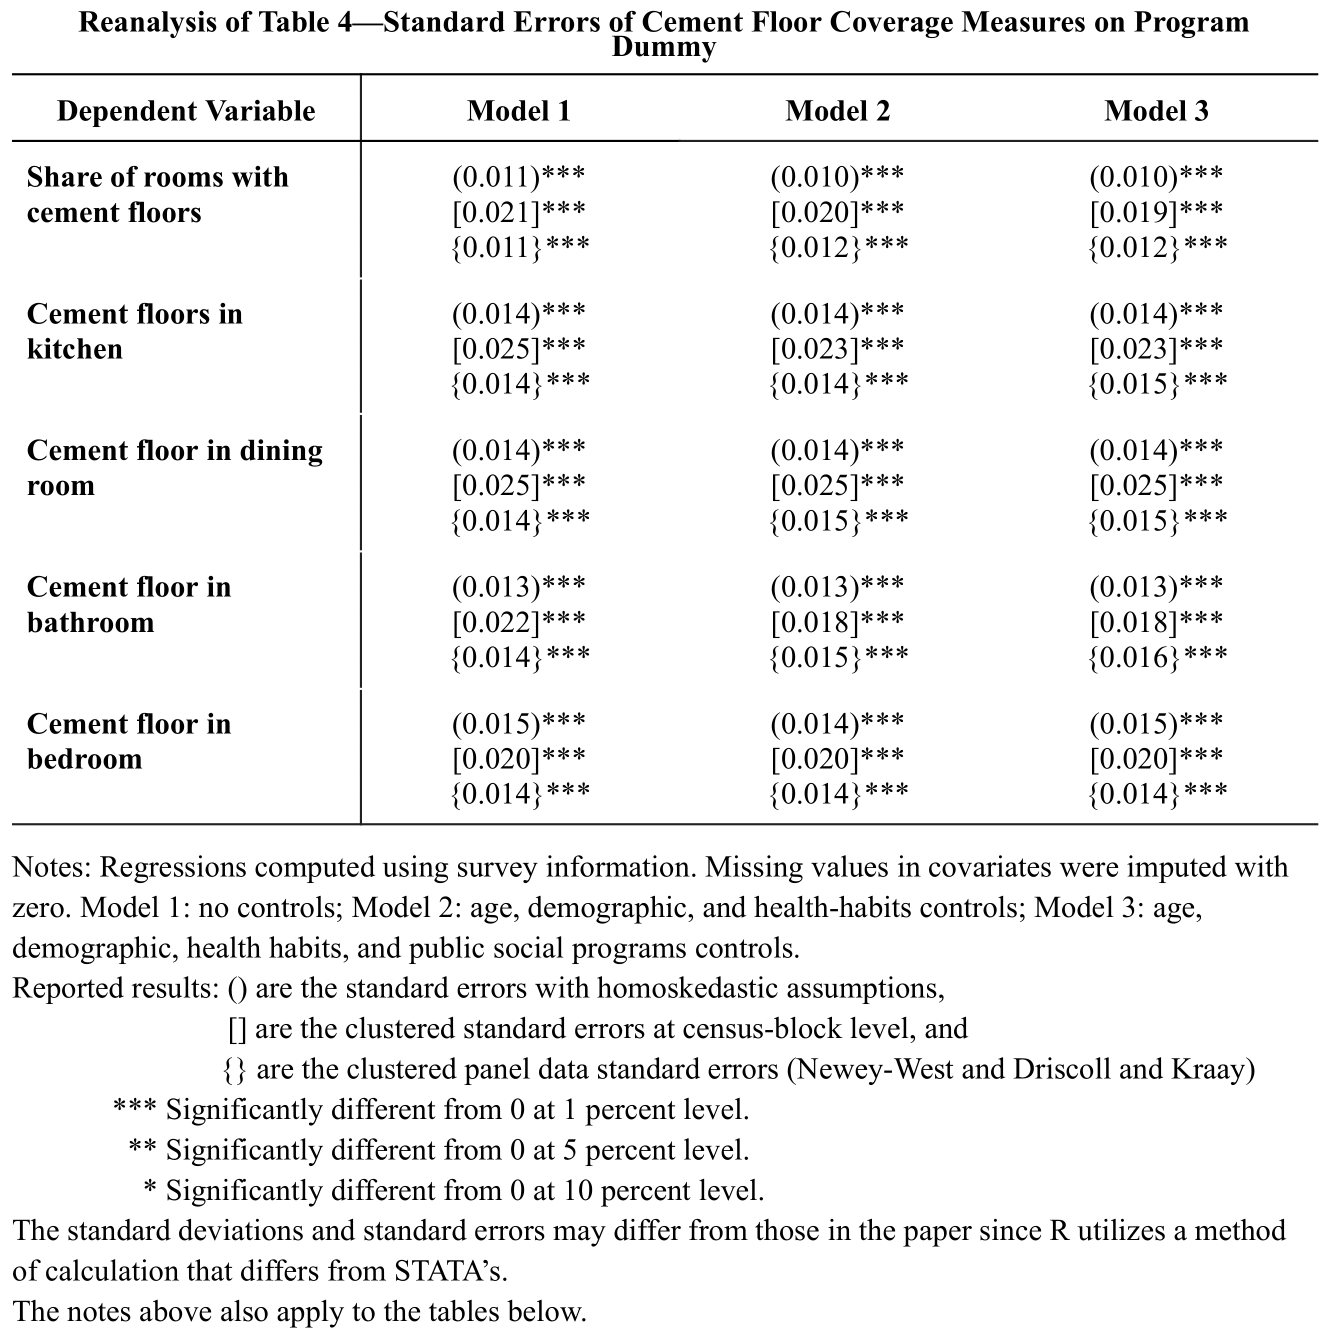
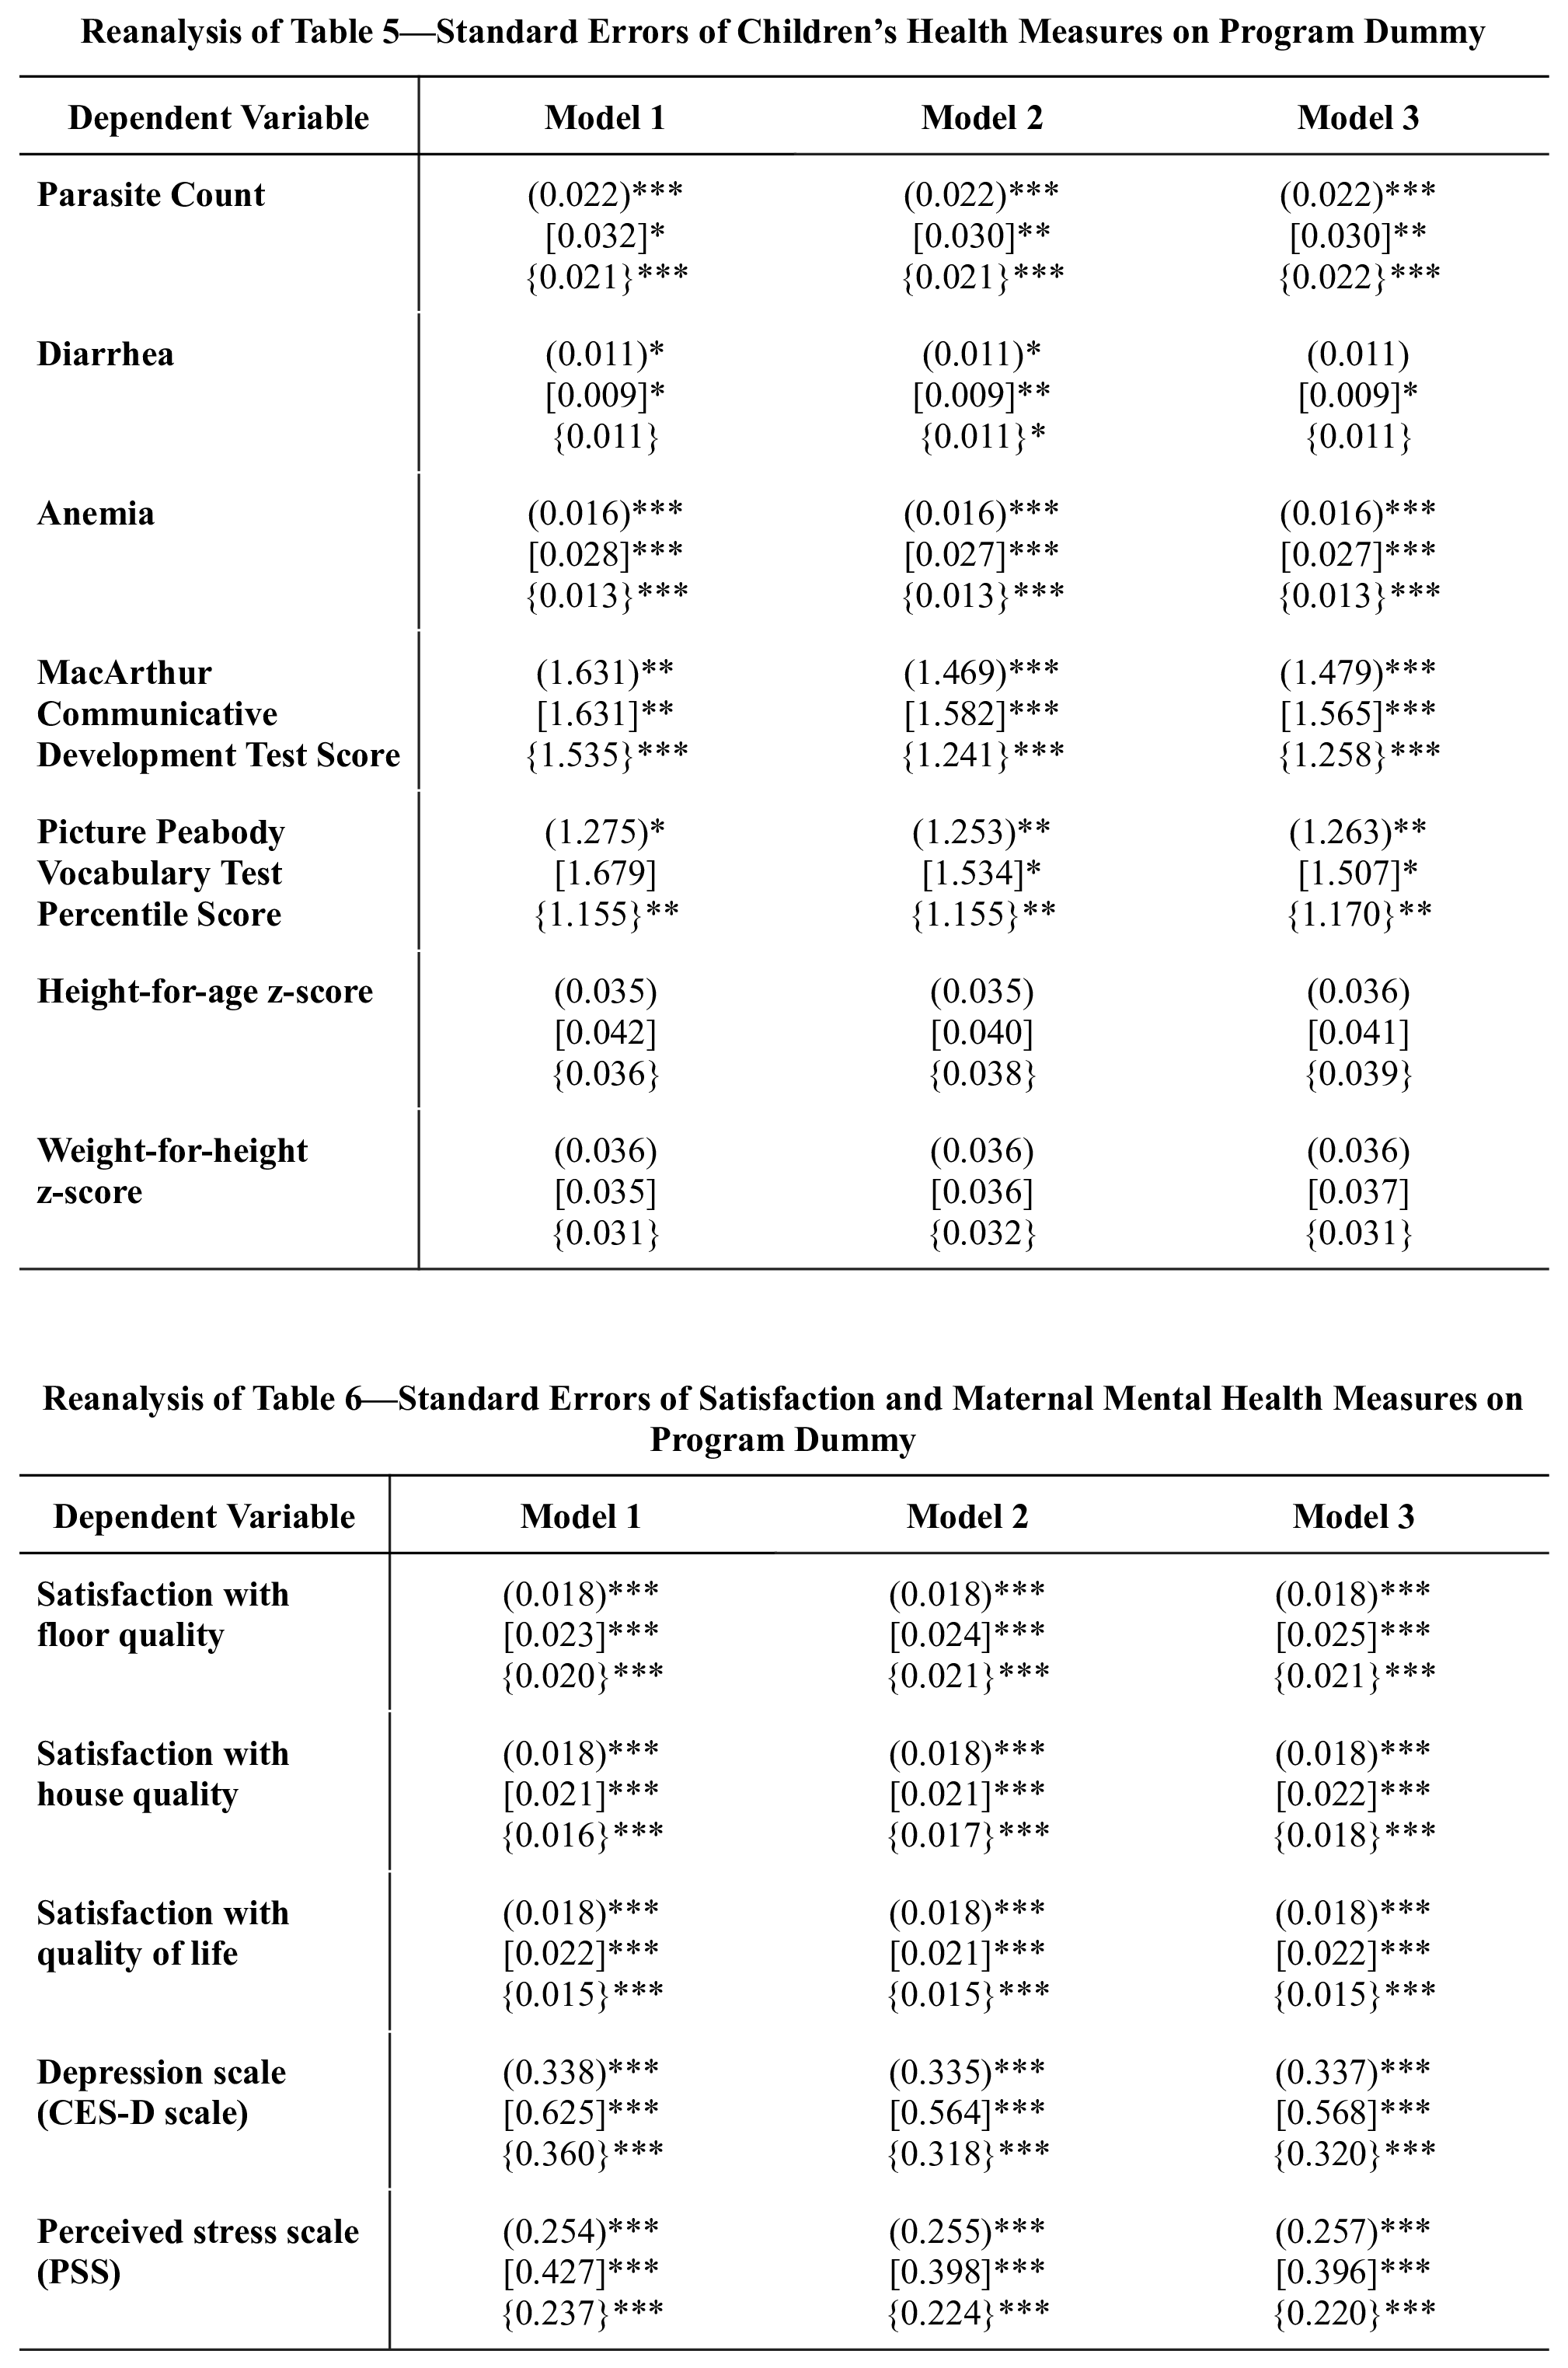
Examining our re-analysis tables above, we note that the values are not particularly different between the naive, CL, or PL standard errors. They typically only differ by one significance level. While these contrasts are slight, the CL standard errors are usually greater than the other two standard errors. Since the standard errors are not substantially different from each other, we verify that our model is not severely misspecified. Additionally, the estimates for each type of standard error are similar across the different models, indicating that our estimates are robust.
The PL standard errors are appropriate for situations where there are observations at many time points so that the autocorrelation over time can be properly adjusted for. On the other hand, if there are not many observed time points, then simple clustering with CL standard errors may suffice. In the case of Piso Firme, and as supported by the re-analysis tables, clustered standard errors are a suitable choice. Moreover, because our data was sampled from a population using clustered sampling and we aim to generalize our findings to the broader population, we conclude that Cattaneo et al. (2009) chose the most appropriate standard error for this analysis.